
[Continued from the previous Trading View post]
I noted that Python has much more room to scale up, but I wondered, to what extent exactly will Scratch confine me?
My goal is to create an algorithmic trading bot, but to ensure it runs on proper data, the visual representation could highlight potential fault lines in the system. Many have accused the financial markets of being unpredictable, but does “random” even exist in the way we understand it today?
There is always a way to slightly boost your odds, and when I covered how to create a Blackjack automation, I learned the beauty of logic, which can also be applied to trading.
There are two core styles of investing/trading: fundamental analysis and technical analysis. Fundamental analysis heavily relies on any information or news related to the asset’s fundamentals. To implement it, I would need access to news outlets’ data. For now, I will focus on technical analysis, which relies only on technical indicators.
So far, traders have developed many indicators to interpret the market trends (even the candles that I plot were developed to simplify the charts). Some of these indicators include:
SMA—Simple Moving Average: pretty much just taking an average of candles in a current horizon to filter unexpected “noise.”
EMA & WMA—Exponential and Weighted Moving Averages: both great ways to put more weight on more recent data points when filtering.
RSI—Relative Strength Index: shows the support behind trends and their sustainability over time and prior movement.
OBV—On-Balance Volume: displays a build-up of public interest in the bull/bear movements.
Others (VWAP’s, ATR’s, TP’s, ADR’s, and hopefully more soon!)—these are more indicators that I won’t bore you with
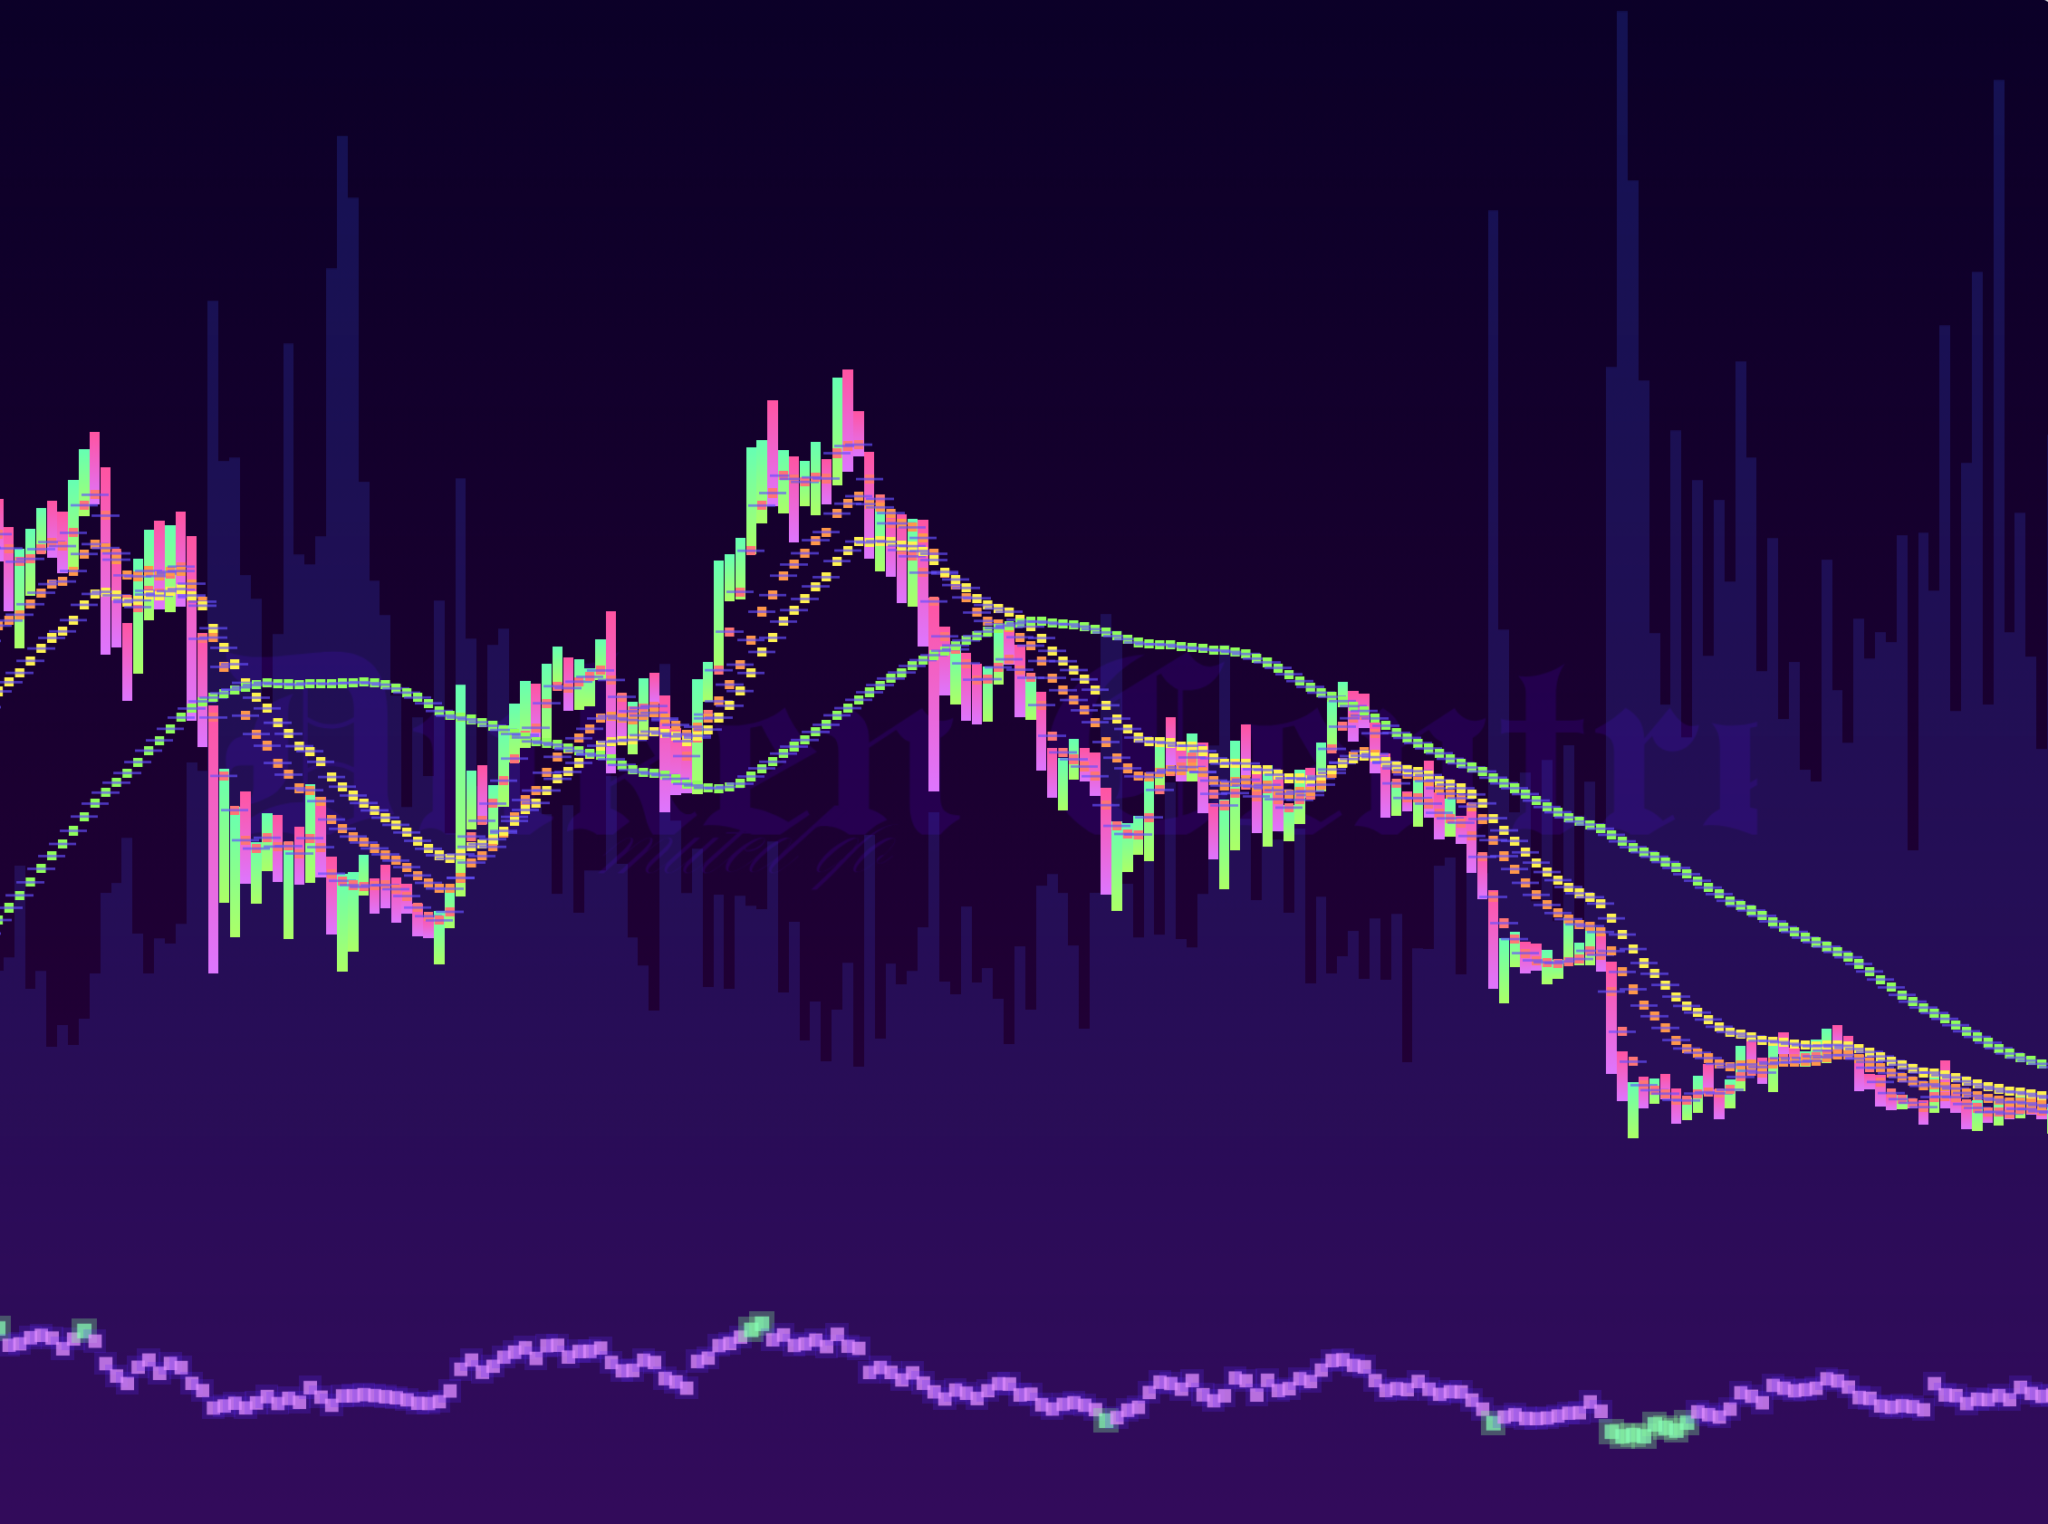
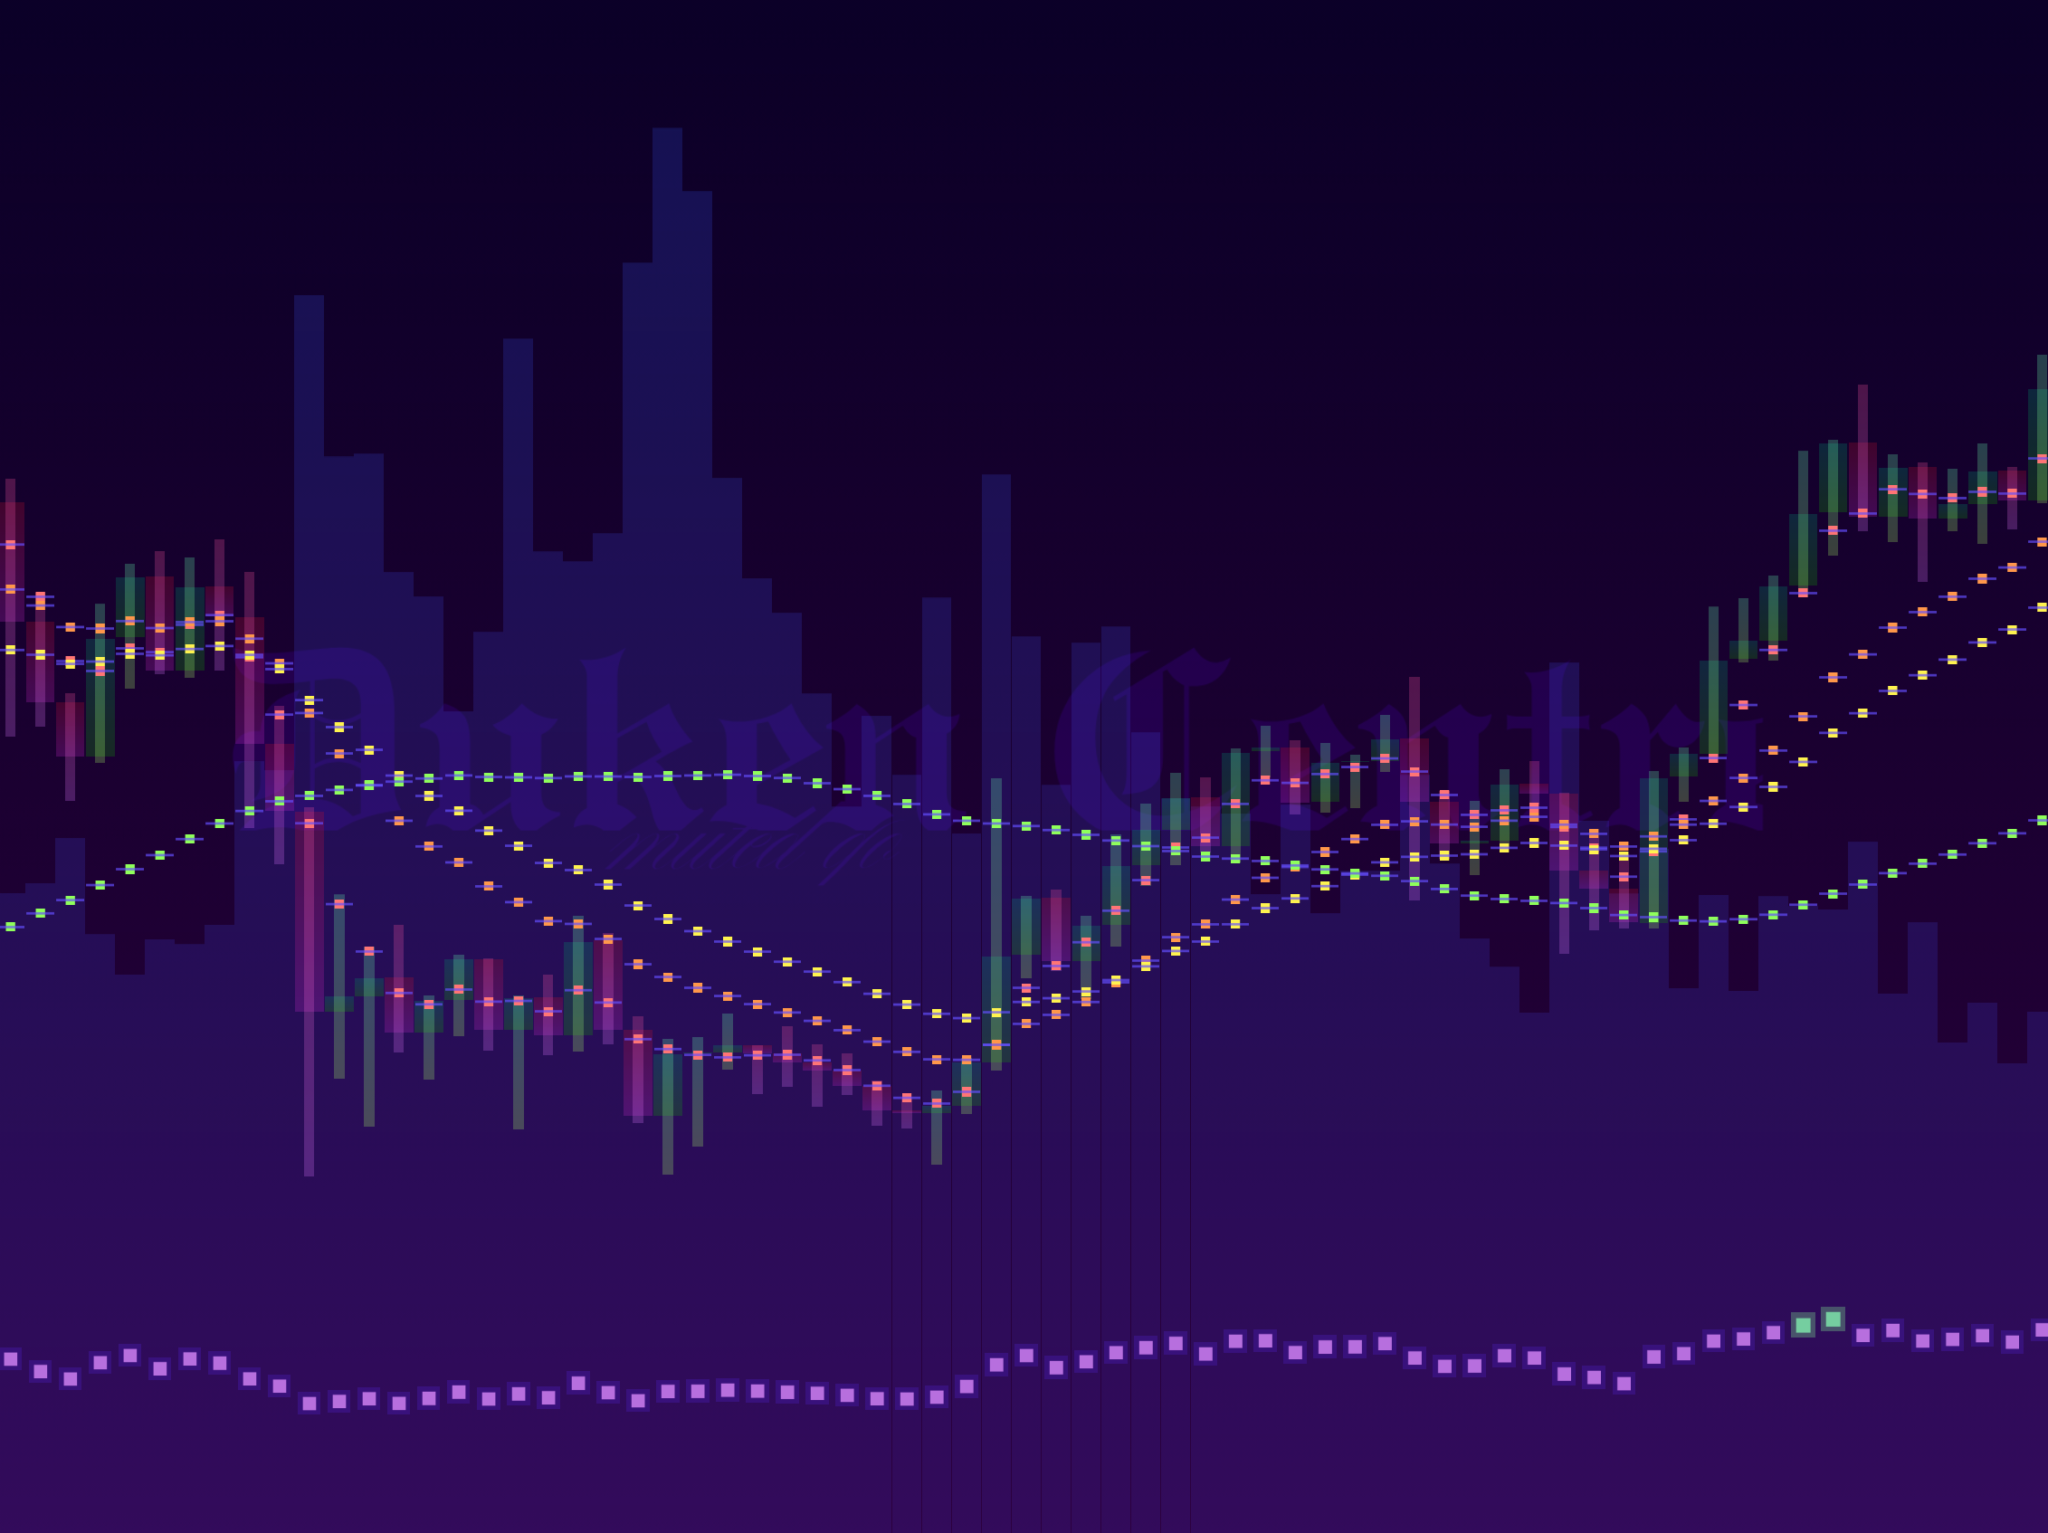
The reason I mention these tools is that they are the ones I have added to my Trading View built in Scratch. Scratch allows me to program five of these indicators at once, and though a bit laggy when loading more plotted data (including the points for MA’s, OBV’s, VWAP’s, ATR’s, TP’s, ADR’s, and RSIs), this truly shows the accuracy and even the extent to which these chores can be replicated—maybe with more code and less block freedom.
Let my video show you the result of 3-day Bitcoin data mapped and annotated with different indicators:
Short Break Before the Next Chunk of Info
Other than that, here is a vibrant, abstract, and sophisticated screenshot of a common trading setup: Weighted Rainbow + RSI Momentum Filter. (Traders usually view it as smaller)
Next Big Update: Predications
What’s the point of indicators if you can’t take sentiment from them? Of course, the end goal is still profit, but can I recreate a thought process in Scratch to simulate a prediction?
Many experienced traders know that predicting the market is really, really hard—maybe impossible without fundamental information (news and other world events). I knew that, though automating the process would eliminate emotion, the hard part would be getting the bot to understand the different variables through coded interpretation. I soon made it possible for the bot to put on a different set of indicators while also extracting information from the graph. When you command the bot to predict one candle in the graph, it will isolate all the information from that candle and the previous candles to gather key points and identify the best prediction for the next candle. This step is repeated 10 times for the 10 different strategies it uses, ranging from short-term surge prediction to long-term momentum evaluation. In the end, it combines all the sentiment to form the five candlestick metrics: Open, High, Low, Close, and Volume. This bot just barely passes the 50/50 threshold—which is great—but I target beyond.
Here is a quick video of one prediction:
If Scratch lasts long enough, my next target is to add MACD and BB by the next update